Tag cloud is a bunch of words drawn in a graph with their sizes proportional to their frequency; it’s widely used in blogs to visualize tags. We can observe important words quickly from a tag cloud, as they often appear in large fontsize. Tony N. Brown asked how to graphically represent frequency of words in a speech the other day in R-help list, which is actually a problem about the tag cloud:
I recently saw a graph on television that displayed selected words/phrases in a speech scaled in size according to their frequency. So words/phrases that were often used appeared large and words that were rarely used appeared small. […]
Marc Schwartz mentioned that Gorjanc Gregor has done some work years ago using R (in grid graphics). The obstacle of creating tag cloud in R, as Gorjanc wrote, lies in deciding the placement of words, and it would be much easier for other applications such as browsers to arrange the texts. That’s true – there have already been a lot of mature programs to deal with tag cloud. One of them is the wp-cumulus plugin for WordPress, which makes use of a Flash object to generate the tag cloud, and it has fantastic 3D rotation effect of the cloud.
Arranging text labels with pointLabel()
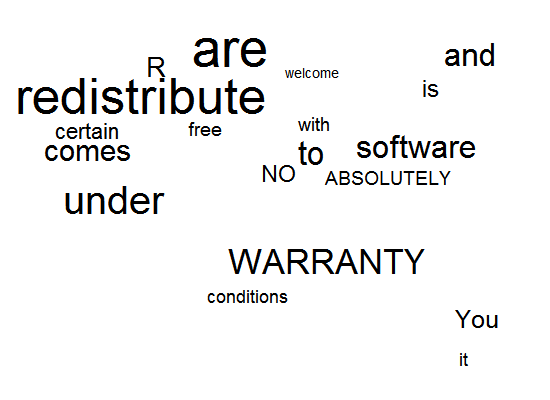
Before introducing how to port the plugin into R, I’d like to introduce an R function pointLabel() in maptools package and it can partially solve the problem of arranging text labels in a plot (using simulated annealing or genetic algorithm). Here is a simulated example:
library(maptools)
set.seed(123)
x = runif(19)
y = runif(19)
w = c("R", "is", "free", "software", "and", "comes",
    "with", "ABSOLUTELY", "NO", "WARRANTY", "You", "are", "welcome",
    "to", "redistribute", "it", "under", "certain", "conditions")
par(ann = FALSE, xpd = NA, mar = rep(2, 4))
plot(x, y, type = "n", axes = FALSE)
pointLabel(x, y, w, cex = runif(19, 1, 5))
I was fortunate to get a very neat graph with no labels overlapping, but I don’t think this is a good solution, as it doesn’t take care of the initial locations of the words. My rough idea about deciding the initial locations is to sample on circles with radii proportional to the frequency, i.e. let x = freq * sin(θ) and y = freq * cos(θ) where θ ~ U(0, 2π). In this case, important words will be placed near the center of the plot.
Creating tag cloud in a Flash movie using R
The problem becomes quite easy with a Flash movie tagcloud.swf and a JavaScript program swfobject.js. The mechanism, briefly speaking, is that the tag information is passed to the Flash object by JavaScript, and the Flash object will read the variable tagcloud where the sizes, colors and hyperlinks of tags are stored. Finally the tags are visualized like rotating cloud.
It’s not difficult to pass the tag information to JavaScript in pure text. The function tag_cloud() in the fun package can create an HTML page with a tag cloud Flash movie inside it.
The main argument is tagData which is a data.frame containing at least three columns (tag, link and count) and looks like:
> head(tagData)
                tag                                        link count
1 2D Kernel Density http://yihui.org/en/tag/2d-kernel-density/     1
2         algorithm         http://yihui.org/en/tag/algorithm/     1
3         Animation         http://yihui.org/en/tag/animation/    11
4           AniWiki           http://yihui.org/en/tag/aniwiki/     2
5            Arcing            http://yihui.org/en/tag/arcing/     1
6          arrows()            http://yihui.org/en/tag/arrows/     1
Additional columns color and hicolor will be used if they exist (hexadecimal numbers specifying RGB), e.g.
> head(tagData)
                tag                                        link count  color hicolor
1 2D Kernel Density http://yihui.org/en/tag/2d-kernel-density/     1 2163bb  f0763d
2         algorithm         http://yihui.org/en/tag/algorithm/     1 9f0f38  d825b1
3         Animation         http://yihui.org/en/tag/animation/    11 800130  5b8d6a
4           AniWiki           http://yihui.org/en/tag/aniwiki/     2 7ce1df  6607b0
5            Arcing            http://yihui.org/en/tag/arcing/     1 df4e4a  f5cdf2
6          arrows()            http://yihui.org/en/tag/arrows/     1 31f5fb  19d50d
Example
Here is an example on visualizing my blog tags.
library(fun)
tagCloud(tagData)
The above code will generate an HTML page. You can adjust the parameters as you wish.
Other issues
There is still one more step to answer Tony’s original question, namely splitting the speech into single words and computing the frequency. This can be (roughly) done by strsplit(..., split = " ") and table().
Encoding problems may exist in the above code, but URLencode(tagXML) could be of help.
Only Latin characters are supported, but there’s possibility to modify the Flash source file to support other languages. See Roy Tanck’s post for more information.
Other R resources I know so far:
- The R package
R4Xby Romain Fran?ois: you can generate an HTML page containing the tags with dynamic classes attached to the<span>tags (install the package and read its vignette:install.packages('R4X', repos='http://r-forge.r-project.org'); vignette('r4xslides', package='R4X')) - The R package
snippetsby Simon Urbanek: there is a functioncloud()to create word cloud; words are arranged from top to bottom and left to right. See the 23rd reply below for an example (thanks, Emilio).
Donate
As a freelancer (currently working as a contractor) and a dad of three kids, I truly appreciate your donation to support my writing and open-source software development! Your contribution helps me cope with financial uncertainty better, so I can spend more time on producing high-quality content and software. You can make a donation through methods below.
-
Venmo:
@yihui_xie, or Zelle:xie@yihui.name -
Paypal
-
If you have a Paypal account, you can follow the link https://paypal.me/YihuiXie or find me on Paypal via my email
xie@yihui.name. Please choose the payment type as “Family and Friends” (instead of “Goods and Services”) to avoid extra fees. -
If you don’t have Paypal, you may donate through this link via your debit or credit card. Paypal will charge a fee on my side.
-
-
Other ways:
WeChat Pay (微信支付:谢益辉) Alipay (支付宝:谢益辉) 

When sending money, please be sure to add a note “gift” or “donation” if possible, so it won’t be treated as my taxable income but a genuine gift. Needless to say, donation is completely voluntary and I appreciate any amount you can give.
Please feel free to email me if you prefer a different way to give. Thank you very much!
I’ll give back a significant portion of the donations to the open-source community and charities. For the record, I received about $30,000 in total (before tax) in 2024-25, and gave back about $15,000 (after tax).