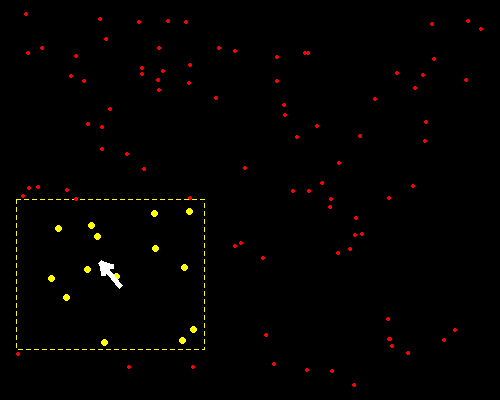
以下是我以前写的一个利用鼠标交互选择点的例子,主要是getGraphicsEvent()函数。
par(bg = "black", mar = rep(0, 4), pch = 20)
xx = runif(100)
yy = runif(100)
plot(xx, yy, type = "n")
mousemove = function(buttons, x, y) {
    r = 0.2
    idx = (x - r < xx & xx < x + r) & (y - r < yy & yy < y + r)
    plot(xx, yy, type = "n")
    rect(x - r, y - r, x + r, y + r, border = "yellow", lty = 2)
    points(xx[idx], yy[idx], col = "yellow", cex = 2)
    points(xx[!idx], yy[!idx], col = "red")
    NULL
}
mousedown = function(buttons, x, y) {
    "Done"
}
getGraphicsEvent("Click mouse to exit", onMouseDown = mousedown,
    onMouseMove = mousemove)
其中r可以自行调整。
赞赏
作为一名没有固定工作的自由职业者,我非常感谢您通过捐赠的方式来支持我的写作和开源软件开发。当然,捐赠纯属自愿。无论金额多少,都是一片诚挚的心意。支付方式如下:
| 微信 | ← 奋力支开它俩 → | 支付宝 |
|---|---|---|
 |
其它爱心通道 ↓ Venmo: @yihui_xie Zelle: xie@yihui.name PayPal: xie@yihui.name |
 |
若使用 Venmo/Zelle/Paypal,请添加备注“gift”或“donation”,以免捐赠被视为我的可税收入。若使用 Paypal,支付类型请选 Family and Friends,而不要选 Goods and Services。
在不影响生活的前提下,我会将收到的捐赠以尽量大的比例回馈给开源社区和慈善机构。作为参考,2024-25 年间我共收到约三万美元捐赠,完税后我转手捐出了一万五千美元。